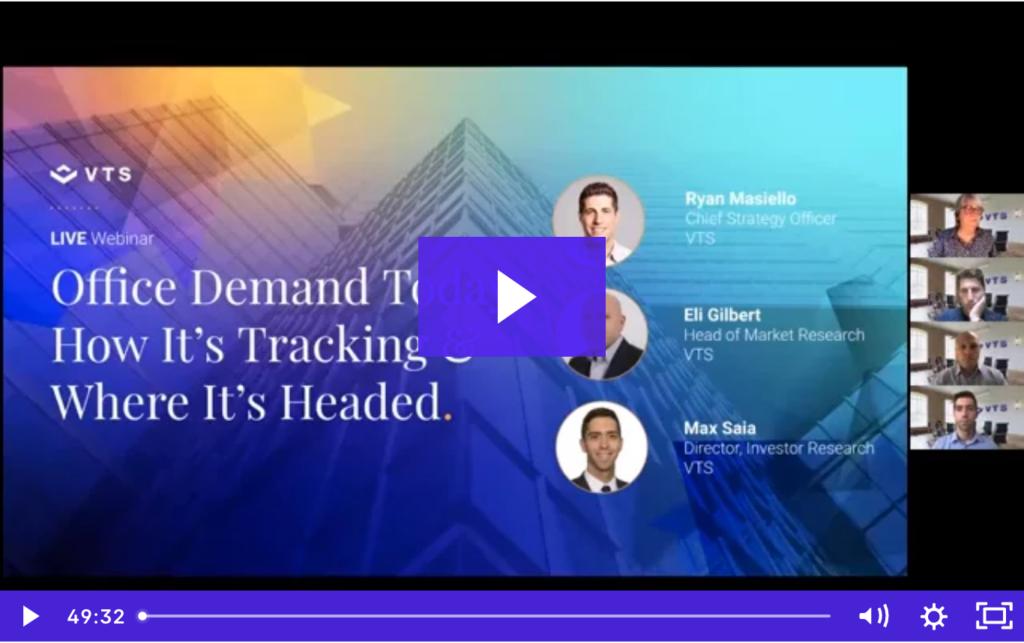
Office Demand Today: How It’s Tracking & Where It’s Headed [Webinar]
Since the start of 2021, national demand for office space has increased well over 150% — and is sitting 5x higher than the May 2020 pandemic low. As top-of-funnel demand returns, stream this Data conversation with VTS executives: Chief Strategy Officer Ryan Masiello, Head of Market Research Eli Gilbert, and Director of Investor Research Max Saia.
In this on-demand webinar, the trio reviews real-time market insights, sourced from the 12B+ square feet of commercial real estate managed on the VTS platform. They also discuss how you can apply office demand insights to your business strategy — converting new touring activity into executed leases.
Enjoy!

VTS: What is the state of commercial real estate market data today, and the vision for VTS Data?
Ryan Masiello: When Nick and I started VTS, part of our core thesis was that commercial real estate is one of the last industries that’s still making massive bets on lagging indicators. At some point, as more institutional capital continues to flow into the market, that would have to change. Fast forward to today, and we’re still largely living in a world where the data we’re using is backward-looking and often very incomplete.
Eli Gilbert: To echo that, the data that we’re using to underpin all our assumptions — whether it’s an acquisition scenario or a lease negotiation — is essentially based on backward-looking data. It’s disjointed, it’s analog, and in many cases, the data is missing the actual attributes you need to make these important decisions.
For example, there are lease comps, which can traditionally be a very small and segmented view of what’s going on in the entirety of the market and you’ve got stacking plans, which are essentially out of date the moment you finish them. Even when the best market research and brokerage teams are cobbling together the information, it’s only a small fraction of what’s really occurring in the market. The data model used in VTS Data is so important because it’s flipping the industry standard on its head and looking forward rather than backward.
Max Saia: I have a deep understanding from both the forecasting and practitioner perspectives of how this backward-looking data creates a ton of friction and risk at every step of the asset lifecycle. And that’s in a normal market environment, let alone the one we’re in today where the market is moving so quickly and with so much uncertainty. VTS Data is a huge step forward in terms of getting more real-time metrics.
Masiello: The vision for this VTS Data is simple. It’s fundamentally to change the way that commercial real estate uses information, not only by unlocking the industry's first real-time dataset but by marrying that with the same cutting-edge analytics and methodologies that change and help every other industry evolve.
Diving into the dataset, it's important to note that at this point, we have about 12 billion square feet being managed on the platform globally. That’s 60% of the Class A office market in the US, and 75%+ on average in the core markets we're going to discuss today. We've far surpassed the tipping point to unlock what’s a very powerful dataset.
In terms of numbers, there are about 45,000 monthly active users. That's brokers, asset managers, and portfolio managers that are logging into the system every single month, pumping in data, and relying on the data in the platform. Last year, that group executed 38,000 deals within the system across 80,000 assets.
Another element that’s critical here is our accounting system integrations. We now have 700+ accounting integrations where we’re tied in directly with the Yardis, MRIs, and Oracles of the world. And on a nightly basis, we’re pulling in all the updated information around tenants, rent roles, step-ups in rents, operating expenses, and more.
With this volume of square footage, usage, and system integrations, our stake in the ground is that we’re very confident that we’re capturing virtually 99% of demand within a market.
VTS: How was the VTS Office Demand Index (VODI) born?
Saia: The VODI is the earliest available indicator of forthcoming office real estate trends, locally and nationally, and represents up to 99% of new demand for office space in seven major markets, including New York City, Washington DC, Los Angeles, Chicago, Boston, Seattle, and San Francisco. The VODI tracks tenant tours, both in-person and virtual, of office properties across the nation. As tenants enter the market in the tour stage monthly, we’re taking those unique requirements, rolling up all the square footage, and then dividing it into the inventory we manage on the VTS platform.
Therefore, the VTS Office Demand Index is powered by proprietary VTS Data, composed of aggregated and anonymized commercial real estate data from the 12B+ square feet of assets managed on the VTS platform.
VTS: How can you put this data to work for their leasing and investment strategies?
Saia: What’s really exciting about all this is that the VODI and VTS Data aren’t just leading indicators for future leasing activity, but can be applied top-down within an organization and throughout the asset lifecycle. It encompasses everything from communicating with investors and having a real-time pulse on the markets teams are covering all the way down to negotiating a large renewal with a tenant at a building or repositioning a vacant space. This is how we’re putting the dataset to work every day for best-in-class adopters of the platform.
When we're trying to help a client determine that optimal asset and leasing strategy, it's all about quantifying the market in a very detailed way. We'll listen to a client’s input and then think about how to slice and dice the data in a unique way so that we can understand how that client can best meet current market demand.
Then we work with them — sometimes running with two or three strategies at a time — to determine which one is optimal. And we’ll continue to monitor the market over time to keep that position moving forward.
Gilbert: Another example of what VTS Data can do is evaluating lease transactions. This is one of the more exciting portions of VTS Data for me personally after coming off a 20-year career trying to cobble together transactional data at the market level. It was incredibly labor-intensive, and still, at the end of the day, you were typically only dealing with a fraction of the overall market.
With the scale, and sheer number, of transactions being negotiated on, VTS Data, we have access across all the top markets into very specific transaction values that are being seen at the class level, submarket level, and even the micro-market level. It’s incredibly exciting to not only see where deals are shaking out from a signed lease perspective, but also what I consider the holy grail of data, which is where proposals are being exchanged.
This product is redefining what “market” means. In the past, “market” was a handful of comps that somebody spent two weeks cobbling together and would shoot over to you. Half are missing free rent, and you don't know the start date on the other half. It's a very painful, very manual, antiquated process. Our redefinition of “market” to what it should be and always should have been, is how the proposals are being exchanged today.
Watch the full webinar on-demand here.
Want more? The VTS Office Demand Index is just a sliver of the insights available in VTS Data. In fact, VTS Data is the industry's only forward-looking market data powered by the $200B in leasing transactions managed on the VTS platform. Our latest infographic — From Positioning to Pricing: Repositioning a Vacancy — shows just one of the many ways you can put this market data to work. You can also learn more about the full VTS Data offering, and get the latest commercial real estate market trends, on our all-new resource page.
![Office Demand Today: How It’s Tracking & Where It’s Headed [Webinar]](https://www.vts.com/wp-content/uploads/2021/10/10.14.21-Office-Demand-Today-How-Its-Tracking-and-Where-Its-Headed-Webinar.png)


