State of the NYC Office Market: Challenges Remain, but Progress Continues
The past 13 months have been brutal on the New York City office market, with office demand briefly all but extinguished at the onset of the pandemic, followed by extremely muted demand during the second half of 2020. However, as vaccination rates continue to grow, there is now positive momentum building on a number of fronts across New York City, including but not limited to, the following milestones:
- May 3: Approximately 80,000 New York City government office workers began returning to the office for in-person work
- May 15: Office occupancy restrictions increase from 50% to 75% capacity
- May 17: NYC Subway returns to 24/7 operation
- May 19th: Occupancy restrictions for NYC restaurants, retail, and museums are eased and only limited to maintaining space to allow for six feet of social distance
- Fall 2021: Approx. 30 Broadway shows are targeting reopening dates
These milestones are critical because in all cities, and particularly in New York, there's a symbiotic relationship, or interdependency, among the industry sectors and essential infrastructure that enables commerce at scale. For example, retail is dependent on tourism, office workers, and the residential population. Likewise, an office environment is more attractive to employees when there is an abundance of retail and entertainment options nearby. Against this backdrop of increasing vaccination rates and key milestones, so far in 2021, high-frequency VTS Data illustrates office demand returning in New York City in real-time. Below, we illustrate three examples:
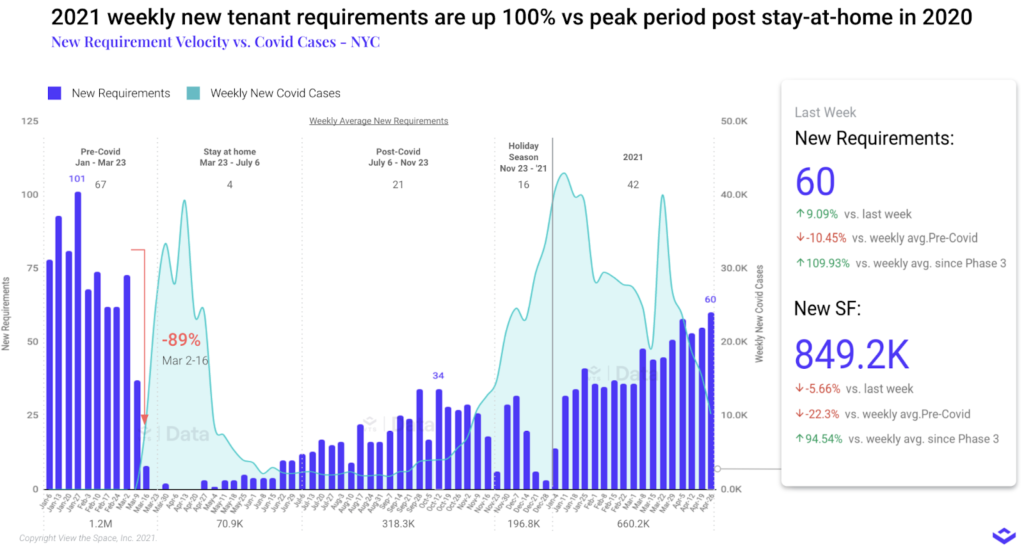
1. New tenant requirement velocity
The chart below illustrates the real-time flow of new tenant requirements (demand) coming into the market touring space on a weekly basis from January 2020 through the last week of April 2021. YTD in 2021 there has been an average of 42 new tenant requirements coming to the market per week, comprising on average a total of 660,000 SF. On a square footage basis, this is more than double the average weekly volume witnessed during the peak period after the onset of the pandemic between July 6 and November 23, 2020. However, it’s still 45% below the average total square feet per week witnessed in the pre-COVID period between January 1 and March 23, 2020.
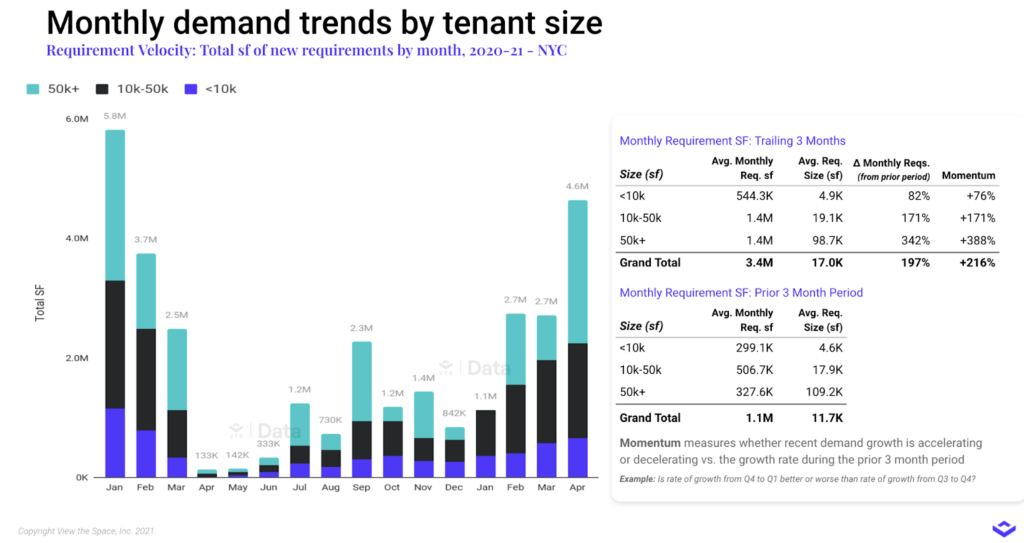
2. Total square feet of new tenant requirements by month
The chart below illustrates the total square feet of new tenant requirements coming to the market on a monthly basis from January 2020 through April 2021. Positively, New York witnessed 4.6 million square feet of new tenant requirements in April 2021, this is the highest total since the onset of the pandemic and the second-highest total in the past 16 months, surpassed only by January of 2020. VTS Data also can surface insights into what size tenants are causing increases in demand. For example, as illustrated in the table below, the increase in demand over the trailing three months has been driven by accelerating demand from tenants in the 10K to 50K SF range, with a pop in April from larger tenants above 50k SF. Given this particular VTS dataset illustrates tenant demand occurring earlier on in the overall leasing process, it is fundamentally a leading indicator of future lease transaction volume, and we expect at least a portion of these new tenant requirements to sign a lease later this year.
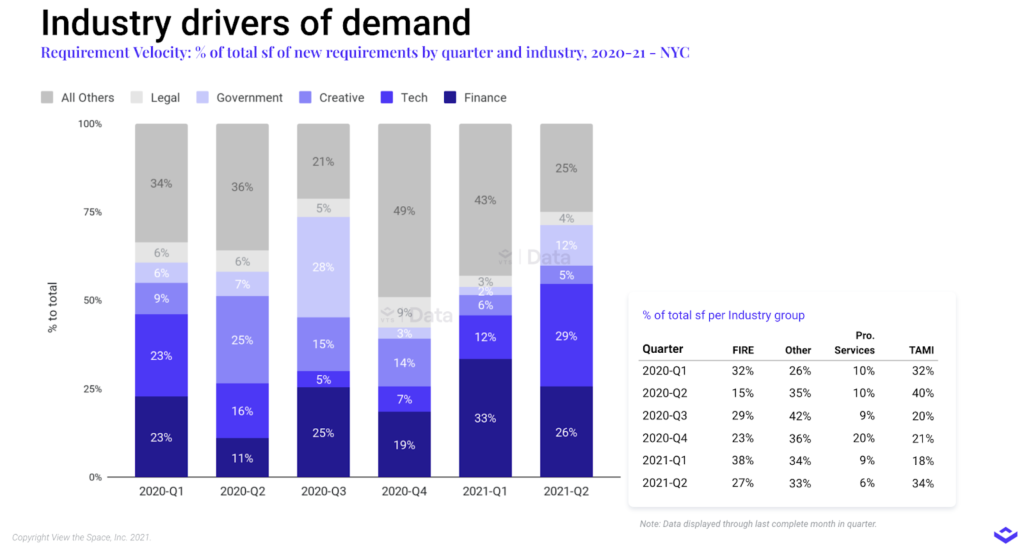
3. Industry drivers of demand
VTS demand data can also surface, in real-time, insights into what industries are active in the market. For example, the chart below illustrates demand by industry sector on a quarterly basis as a percentage of total new square feet of demand. The finance sector has played a consistent role in demand for office space in New York over the past five quarters as well as so far in Q2 2021. In contrast, the technology sector, a major growth sector over the past decade in New York, comprised 23% of new demand during the first quarter of 2020 before falling off severely to only 5% in Q3 2020 and 7% in Q4 2020. Following an increase to 12% in the first quarter of 2021, in the first month of Q2 2021, the technology sector comprised 29% of new demand. All this suggests that after remaining largely on the sidelines during the second half of 2020, new office requirements from the tech sector have started to return in earnest so far in 2021.
The return to the office in New York City
In recent weeks, as organizations of all sizes and across industries continue to evaluate feedback from employees and concurrently gain greater confidence in their ability to operate safely in-person, more and more are firming up plans and deploying capital to transition people back to the office. These plans often encompass varying iterations of hybrid and/or flexible working arrangement models.
One example is Google, where CEO Sundar Pichai indicated in a blog post that in places where the tech giant has been able to reopen offices in a voluntary capacity, they have seen 60% of Googlers choosing to come back to the office already. Another is Blackstone, announcing on May 10th it would be asking US investment professionals to be back in the office full-time on June 7th joining an array of finance, banking, investment, and asset management firms planning similar approaches between the summer and fall of 2021.
The takeaway
The growing return of demand for office space is welcome news to the office industry. However, it will take more than a few decent months for the aggregate level of demand to return to something resembling what was in place prior to the onset of the pandemic. In the months ahead, as conditions continue to evolve, organizations of all sizes will be testing, evaluating, and adjusting operational models as they receive continuous feedback on what’s working and what’s not. It’s likely that it will be sometime in 2022 before we have a clearer grasp on which office utilization and operational model trends are likely to last long term. In the meantime, a resolute New York appears well-positioned for continued healing. If you have space to lease in New York and have not already done so, the time is now to act and ensure you are well-positioned to capture demand for office space as tenants continue to return to the market.
Want more? VTS Data is the industry's only forward-looking market data powered by the $200B in leasing transactions managed on the VTS platform. Our latest infographic — From Positioning to Pricing: Repositioning a Vacancy — shows just one of the many ways you can put this market data to work. You can also learn more about the full VTS Data offering, and get the latest commercial real estate market trends, on our all-new resource page.